
Comprehensive data for a good indoor climate
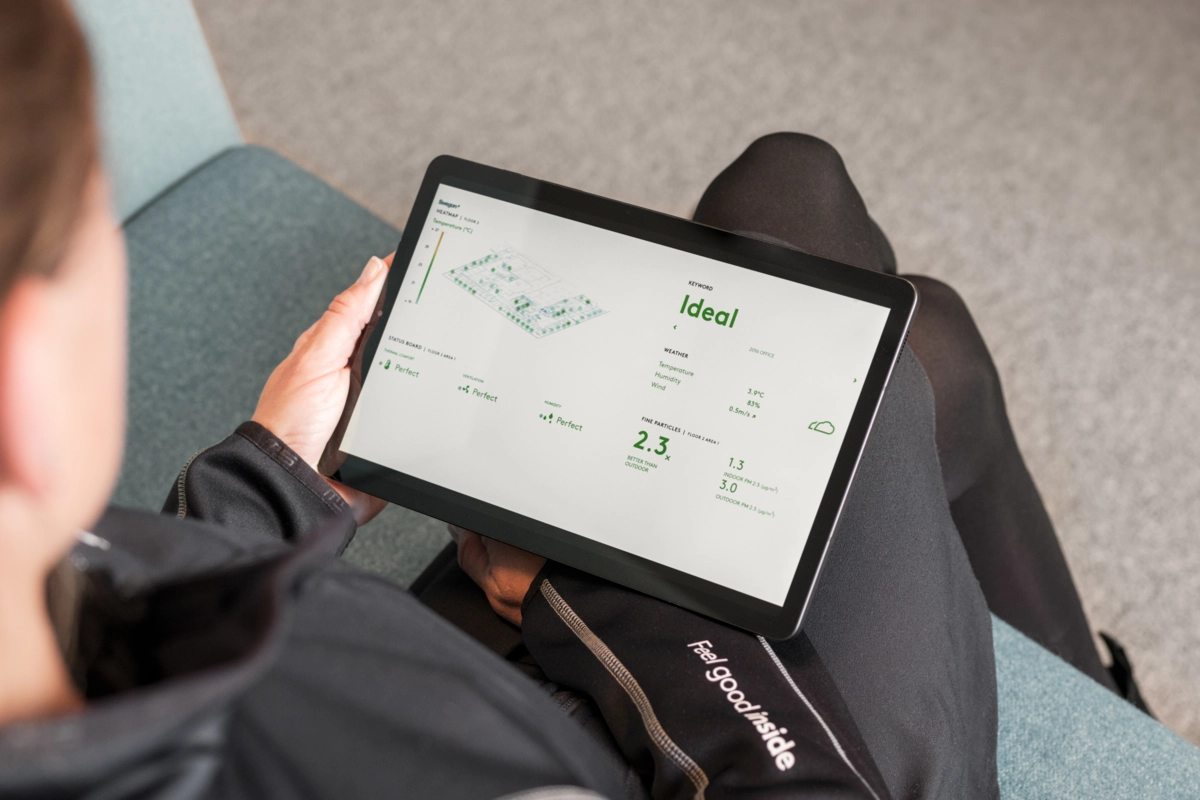
INSIDE Analytics collects large amounts of data and INSIDE Visualiser presents the indoor climate conditions in a digital interface for easy understanding and greater tenant satisfaction.
The feedback was difficult to interpret
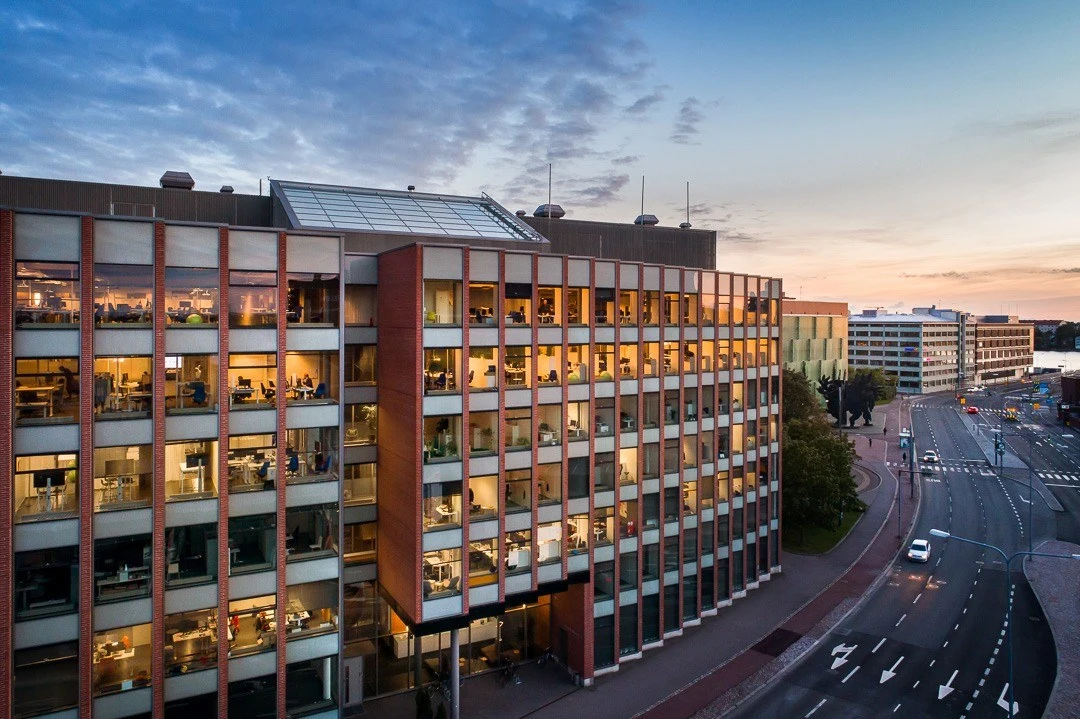
This office building is located in Ruoholahti, Finland. People working in the offices raised various complaints about the indoor climate, but these differed. Some felt it was too cold, while others thought that it was too warm. There seemed to be no apparent reason why their experience of the indoor climate was both dissatisfactory and so varied.
The questions regarding the indoor climate were discussed with the property manager, who also did not have a clear answer.
Take on the problem together
The IT Ops and Facility Lead with the tenant, met with Raul Mansikka, Property Manager at Antilooppi, and together they began sorting out ways to improve the general perception of the indoor climate. At that point, focus was on finding a solution together, and since the tenant expressed their interest in the project, it was decided to move forward.
One of the first challenges was figure out where in the building the potential issues originated.
*Image borrowed from antilooppi.fi
Project took off well
The project team engaged with the services offered by 720°, a Swegon Group company, and was given clear instructions on how the measurements should be carried out and where sensors were to be installed. The sensors placed throughout the building provided the back-end service, INSIDE Analytics, with large amounts of data.
Real-time information about the indoor climate conditions on each floor was highly appreciated by Antilooppi, it gave them a much stronger basis for preparing their maintenance team. Alerts triggered when values fell outside predefined thresholds and immediately activate the team, this without requiring separate notification from the leaseholder.
INSIDE Analytics & Visualiser
The back-end data collection service has strong analytics capabilities and is therefore called INSIDE Analytics. Within Swegon, it is paired with the front-end service called INSIDE Visualiser. This service presents indoor climate conditions through an interface that is both easy to understand and visually attractive.
Providing access to data that explain the indoor climate, significantly improved the situation in the office. The information delivered by INSIDE Analytics & Visualiser helped the tenant's employees to better understand what their bodies have been trying to tell them.
Almost no complaints, from any of the two locations
The tenant was so satisfied with the outcome of using the INSIDE services in Finland that the same set-up was also implemented in their German office in Berlin. The results have been the same, there are almost no complaints, comments or requests. People seem to appreciate receiving the high-quality data analysed and visualised, and that way helping them to better understand their perception of the indoor climate.
“We were actually a bit surprised by the result of collecting and presenting indoor climate data, but it has been equally impressive in both offices”IT Ops and Facility Lead with the tenant
Read more, learn more

Blog: Why leaving the indoor climate to chance?
Learn more about the role our INSIDE services play in today's digital world.